Observability
aos obs shows what this machine has been asked to do. Every command, typed at a terminal or called as an MCP tool, records one OpenTelemetry-shaped span in a local file.
Example
Section titled “Example”$ aos obs statsroute calls errors p50ms p95ms maxmscommands 52 0 0 0 0file delete 43 18 0 0 0capture screenshot 16 0 142 160 160system info 15 0 29 36 36doctor 14 0 175 187 187window list 14 0 38 45 45$ aos obs tail --limit=301:05:30 ok cli 15ms network status01:05:35 err cli 0ms file delete01:05:36 err cli 0ms file delete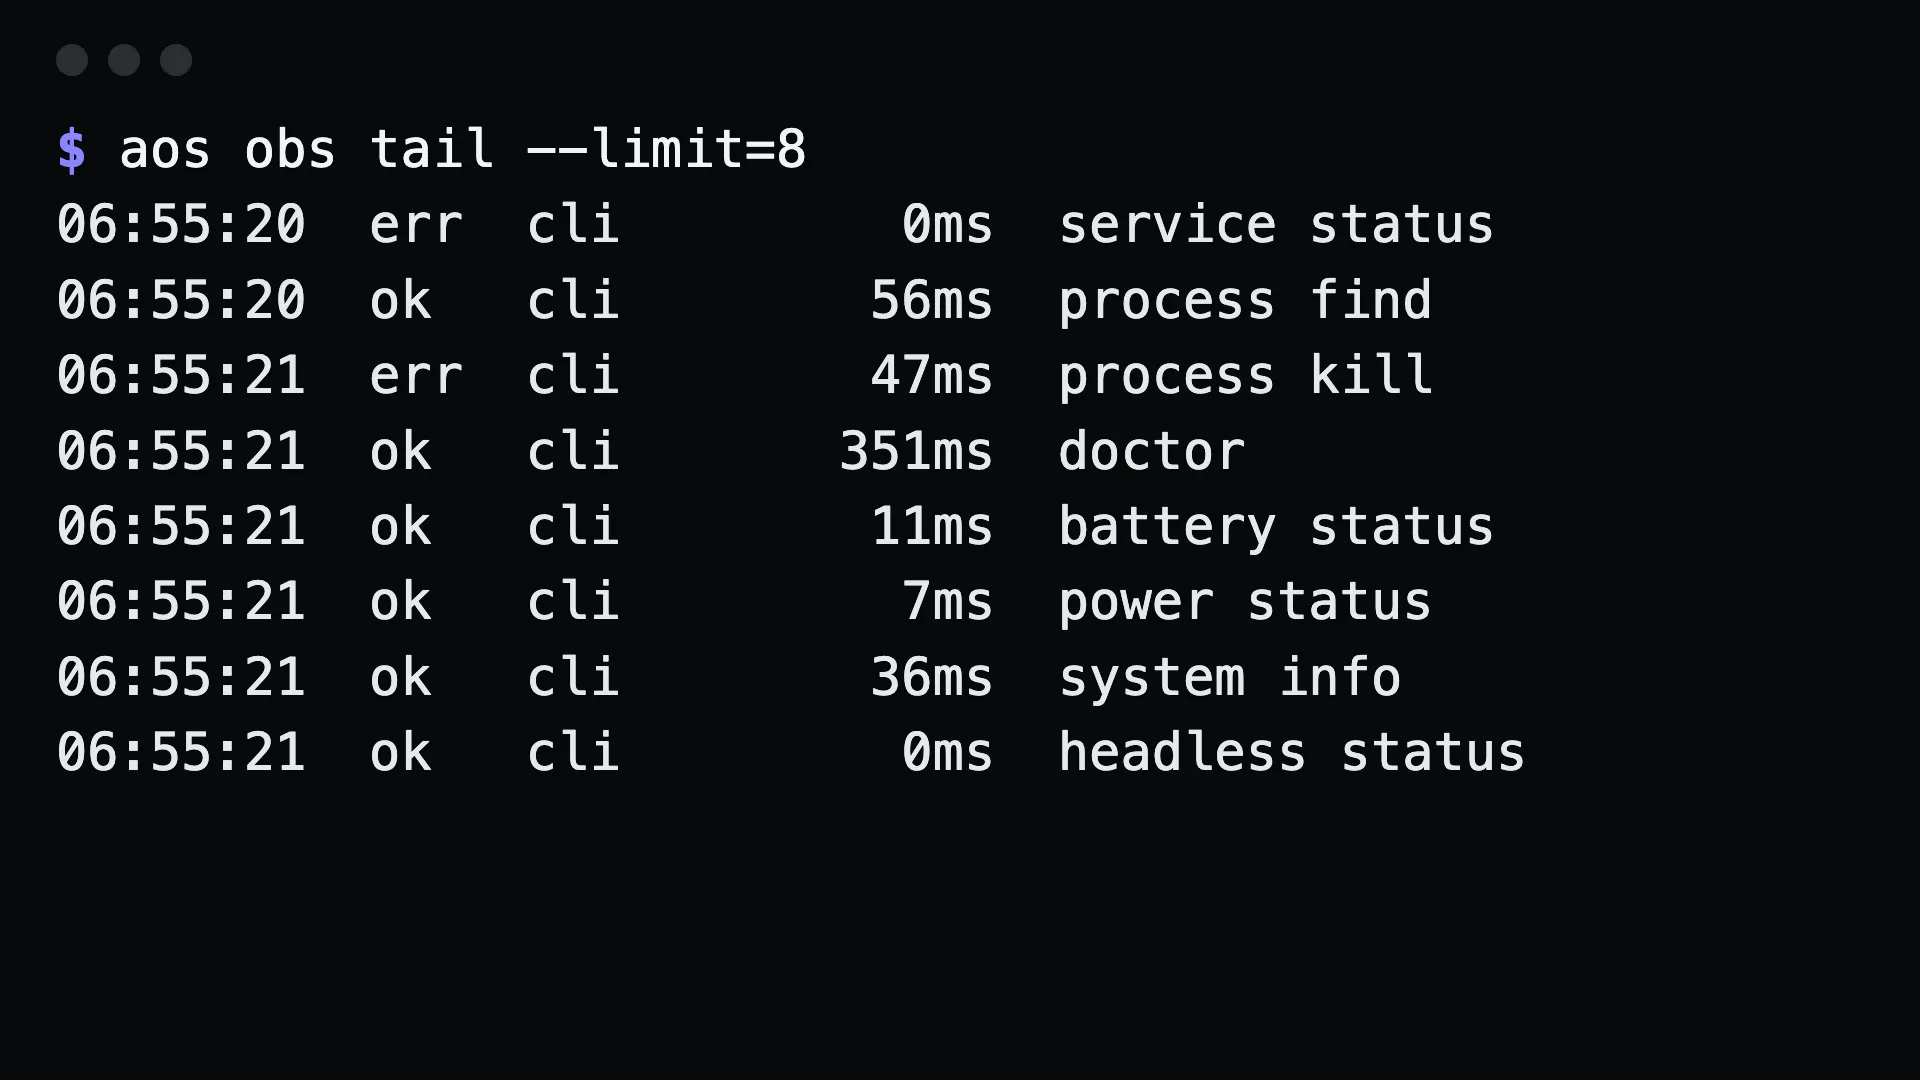
Commands
Section titled “Commands”aos obs audit --since=24h --source=mcp # everything an agent asked for, oldest firstaos obs audit --failed # only the commands that failedaos obs summary --since=7d # how much the machine is used, and by whataos obs stats --since=24h --source=mcp # calls, failures and latency per routeaos obs tail --limit=20 # the most recent spansaos obs export --since=1h > spans.json # OTLP JSON, ready for a collectoraos obs path # where the file lives--source=cli|mcp separates what you typed from what an agent called. That is the main reason this exists.
What a span holds
Section titled “What a span holds”The route, the source (cli or mcp), the exit code, the duration, and the number of arguments. Never the arguments themselves. Arguments routinely carry paths, message bodies and clipboard text.
Turn it off, or move it
Section titled “Turn it off, or move it”AOS_TELEMETRY=off aos window list # do not record this runAOS_TELEMETRY_DIR=/tmp/t aos obs path # record somewhere elseExport either variable in your shell to make it permanent.
Gotchas
Section titled “Gotchas”- It is a file on your disk. Deleting it is fine.
aos obs pathshows where. - Nothing is uploaded.
obs exportwrites to stdout. Sending it to a collector is your step. - Spans are per machine. Over SSH, run
aos obs auditon the server to see what happened there.